Note: This Washington Watch snapshot can also be read in a page by page version
or printed out in this full printable version.
Snapshot 3
October 4, 2008
Snapshot 3:
Act IV - The Debates 9/26-10/15 - Has Begun
Audience For The 1st Presidential Debate: Nothing Special
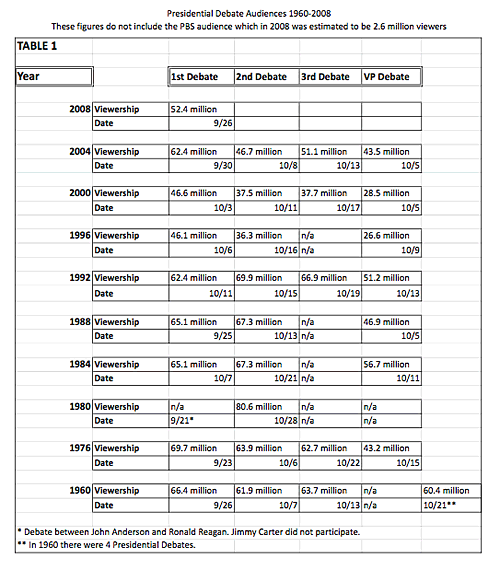
There was a high expectation that interest in the first 2008 Presidential debate would set an audience record. That did not happen. In fact, the audiences for the 1st debate in 2004, 1992, 1988, 1984, 1976, and 1960 were all larger.
The highest recorded audience for a "1st" debate was in 1980. In that year there were two debates. The first debate took place between John Anderson and Ronald Reagan. The second debate matched Reagan against Jimmy Carter. That second debate drew the highest TV audience in history at 80.6 million viewers.
Post-debate polling this year found Barack Obama to be the winner. A series of individual battleground States polls taken since the debate show Obama increasing his margin in those States. Further, the Diego/Hotline polled in 10 battleground States as a group, and found Obama with a 10 point margin, up from a 3 point margin a week earlier.
WW had the following reaction to the debate.
- Neither man came to win.
- Both men came not to lose.
- Both men achieved their goals.
Biden vs. Palin
Sarah Palin and Joe Biden each did what they had to do.
Palin proved she could do 90 minutes on a variety of subjects, hold her own, and, for many, exceed expectations. She came to talk to the audience seated in front of their TV sets around the country, with little regard for the specific questions asked, and she pulled it off. Her focus was on proving that John McCain made a responsible choice. As she did with her convention speech, she proved to be poised in a high profile, potentially tense, situation.
Biden established the value of his knowledge and experience, and disappointed those who spent 90 minutes waiting for him to commit some form of gaffe. He walked a tough line in treating Palin respectfully. His focus was on showing why Obama is a better choice than McCain. He proved that he did have the rhetorical discipline that he is often accused of lacking.
For what it is worth, CNN's post-debate poll produced mixed results.
- Biden was selected as the winner by 51-36%, but Palin was deemed more likeable by 54-36%
- 84% said Palin exceeded expectations, while 64% said that about Biden
- Biden trumped Palin as to who was qualified to be President: 87% rated him as qualified, while 42% accorded her that score
This debate drew a larger audience – 69.9 million viewers, more than the presidential debate the week before which drew 52.4 million viewers. It was the largest presidential or vice presidential debate audience since the 2nd presidential debate in 1992 which also drew 69.9 million viewers.
Tune in Tuesday, October 7th, for the 2nd Presidential debate.
Here are available audience figures for all Presidential and Vice Presidential debates.
Tracking the Presidential Campaign
A number of organizations maintain daily tracking polls. While some knowledgeable sources question the reliability of these surveys, they are the best way we have of tracking the election on a "daily" basis.
WW has chosen to follow the Gallop and Hotline/Diego tracking polls. Each of the surveys accumulates 3 days worth of interviews. If the date in the chart below is September 30, it means that interviews were conducted on September 28, 29 and 30. Gallop accumulates 2700 interviews (margin of error +/- 2 points). Hotline/Diego accumulates 900 interviews (margin of error +/- 3.3 points). [RV - registered voters; LV - Likely voters] [O - Obama; M - McCain]
| Date | Gallop | Hotline |
| 9/24 | Tie RV | O + 4 RV |
| 9/25 | O + 3 RV | O + 7 RV |
| 9/26 Pres Debate | O + 5 RV | O + 5 RV |
| 9/27 | O + 8 RV | O + 5 RV |
| 9/28 | O + 8 RV | O + 5 RV |
| 9/29 | O + 6 RV | O + 6 RV |
| 9/30 | O + 4 RV | O + 5 RV |
| 10/1 | O + 5 RV | O + 5 RV |
| 10/2 VP Debate | O + 7 RV | O + 6 RV |
Various news organizations maintain electoral vote counts that are periodically reassessed and updated. Each organization has its own formula for deciding which candidate will receive a State's electoral votes. The chart below summarizes a number of those reports as of October 1, 2008:
(WW has taken the liberty of lumping together firm and leaning counts to the extent those categories are used by a given organization.)
| Obama | Toss-UP | McCain | |
| CNN | 250 | 99 | 189 |
| 538.com | 331 | -- | 207 |
| MSNBC | 212 | 152 | 174 |
| NYTimes | 255 | 56 | 227 |
| Pollster.com | 250 | 125 | 168 |
| RCP | 260 | 115 | 163 |
The Role that Race May Play in the Election
Will race be one of the issues that play a role in voter decisions in the Presidential race? The answer is yes, but what is not clear is how big a role it will play.
A variety of polling organizations have attempted to calculate the impact of race in particular elections. But for all of their efforts, predicting the impact of race, is more often than not, the result of guesstimates.
Recently, the AP/Yahoo News Poll attempted to answer this overriding question with an online survey (8/27-9/5) from a sample developed by an organization called Knowledge Networks. There is some evidence that respondents will more readily admit to unpopular positions when "answering questions on a computer rather than talking to a stranger" on the telephone.
Here are some of the findings from that survey. (The survey did raise questions about issues other than race.)
- 1/3 of white Democrats harbor negative views toward blacks
- Obama's support might be as much as 6 points higher, but for white racial prejudice
- Race is not the biggest factor costing Obama support among Democrats and Independents. Questions of competency, and doubts about his ability to bring about change, loom larger.
The New Voters
There appears to be many newly registered voters (predominantly young people), but will they vote?
The good news for Obama is that they support him over McCain by 61% to 30%. This compares to a 2% point advantage for Obama in the most recent NBC/WSJ survey of the whole electorate.
The not-so-good news for Obama is that this group of people is significantly less interested in the election than the electorate as a whole. On a 10-point scale (10 is very interested), 49% of the new voters describe themselves as 10s versus 70% of the total electorate who give themselves this score. Further, only 54% of the new voters say they will definitely vote.
Here are some other findings from the survey [NV - new voters; ALL - all voters]:
- 81% of NV think the country is off on the wrong track as compared to 73% of ALL
- 72% of NV believe that government should do more to solve problems as compared to 48% of ALL
- 16% of NV are positive about President Bush as compared to 30% of ALL
- 30% of NV are positive about McCain as compared to 46% of ALL
- 58% of NV are positive about Obama as compared to 48% of ALL
- 31% of NV are positive about Biden as compared to 37% of ALL
- 28% of NV are positive about Palin as compared to 42% of ALL
- New voters and All voters do have at least two things in common,
- 19% of each group has "a great deal or quite a bit of confidence in the Federal Government"
- 10% of each group has "a great deal or quite a bit of confidence in the financial industry"
White Women and the Election
It has been suggested that Obama is not doing as well as he needs to among white women, and single white women in particular.
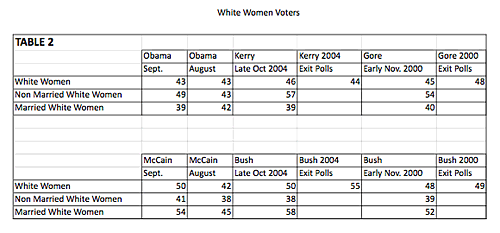
In the September NBC/WSJ survey Obama was losing white women to McCain 50-43%. But, he was winning among single white women by 49-41%. He trails McCain by 5 points among married white women.
When compared to John Kerry and Al Gore in final 2000 and 2004 pre- election polls, among single white women Obama is trailing by 8 points as compared to Kerry and by 5 points as compared to Gore.
Among married white women, Obama is running about even with Gore and Kerry.
McCain runs about even with Bush in pre-election polls in 2000 and 2004 among single white women, as well as among white women generally in those pre- election polls.
Among married white women McCain runs behind Bush in 2004, but ahead of Bush in 2000.
A Final Look at the Convention Audiences
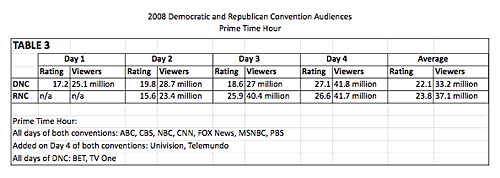
The Nielsen ratings published after the convention did not include the PBS audience. The table below does include the PBS audience.
The audience sweepstakes produced the following result
- Obama speech - 41.8 million viewers
- McCain speech - 41.7 million viewers
- Palin speech - 40.4 million viewers
- Hillary Clinton speech - 28.7 million viewers
- Biden speech - 27 million viewers
Based solely on the Nielsen ratings;
- 120.1 million people watched the conventions
- 73.2 million homes watched at least one convention
- 15% of all households watched only the RNC convention
- 15.7% of all households watched only the DNC convention


