October 4, 2014 11:58 AM
Where have all the voters gone
“Where have all the voters gone”As voting has been made easier by wider use of no-excuse absentee voting, mail voting, and early voting generally, turnout has gone down.
Prior to 1972, only Tennessee and Idaho offered so-called “no excuse” absentee voting. In all other states if you wanted to vote absentee you needed a reason. In 1972, less than 5 percent of American voters used absentee ballots.
In 1975 Congress enacted the Overseas Citizens Voting Rights Act which allowed overseas voting age eligible U.S. citizens without legal domiciles in the United States to vote absentee. Additional legislation in 1986 eased the ability to register.
In 1978, California began absentee voting for anyone by request. By 2010, 40.3% of Californians voted absentee.
In 2008, almost a third (32%) of all voters cast their ballots BEFORE Election Day.
By 2010, including in-person early voting, 30% of voters who cast ballots did not go to the polls on election day. Almost 16% of votes cast were absentee ballots, and nearly 5% more were mail ballots.
For the 2014 General Election:
- 27 States plus the District of Columbia offer no-excuse absentee voting
- North Carolina, Minnesota, Maine, New Jersey, South Dakota, and Vermont all start the week of September 15th-20th
- 33 states and D.C. allow any qualified voter to cast a ballot in person during a designated period prior to Election Day
- Minnesota will become the 27th state to offer no-excuse absentee voting
- Colorado will become the 3rd state to offer all-mail voting for all elections
Sources: Census Data, U.S. Election Assistance Commission’s Election Administration and Voting Survey
Summary of Adoption of Voting Reforms
| Number of States w/ No-Fault Absentee Voting | Number of States w/ Early Voting | |
| 1972 | 2 | 5 |
| 1976 | 3 | 6 |
| 1980 | 6 | 7 |
| 1984 | 6 | 7 |
| 1988 | 6 | 9 |
| 1992 | 12 | 11 |
| 1996 | 16 | 14 |
| 2000 | 22 | 22 |
| 2004 | 24 | 27 |
| 2008 | 27 | 31 |
The net result of these early voting opportunities is that overall voter turnout has gone down.
Only mid-term general elections are included in the following analysis.
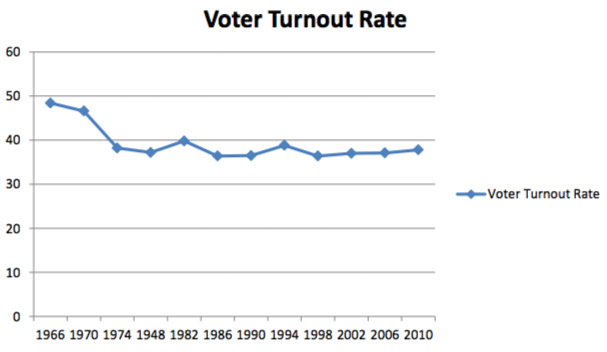
As you might expect, turnout has gone up in some States and down in others. Results are likely affected by which States have significant contests in a given election. However, those differences do not account for a drop since 1966 of as much as 12% points in certain elections in 1986 and 1998.
In 2010, the turnout was 37.8%, a drop of 10.6% points.
The following is the Voter Turnout Rate for the 1966-2010 mid-term General Elections:
| Voter Turnout | |
| 1966 | 48.4% |
| 1970 | 46.6% |
| 1974 | 38.2% |
| 1978 | 37.2% |
| 1982 | 39.8% |
| 1986 | 36.4% |
| 1990 | 36.5% |
| 1994 | 38.8% |
| 1998 | 36.4% |
| 2002 | 37% |
| 2006 | 37.1% |
| 2010 | 37.8% |

[Source: Jan E. Leighley, Jonathan Nagler; The Effects of Non-Precinct Voting Reforms on Turnout 1972-2008, produced by Pew Charitable Trust, January 15,2009]
In the 2010 mid-term election the participating voter group of eligible voters included 48.6% of whites, 44% of blacks, 31% of Hispanics, and 31% of Asians. [Pew]
