August 15, 2008 10:51 AM
Washington Watch's History Of Major Party Conventions
Milestones
* 1831 - The first Presidential nominating convention was conducted by the Anti-Masonic Party.* 1832 - The Democratic Party conducted its 1st national convention.
* 1856 - The Republican Party conducted its 1st national convention.
* 1912 - Longest Republican convention, which ran 5 days. Conventions of similar length were conducted by the Republicans in 1920, 1940, 1948 and 1952.
* 1924 - Longest Democratic convention, which ran 16 days. 5-day conventions were the next longest, in 1952, 1956 and 1960.
* 1932 - FDR was the first Democratic nominee to accept the nomination in person.
* 1944 - Tom Dewey was the first Republican nominee to accept the nomination in person.
* 1944 - Democrats and Republicans held their shortest conventions, 3 days in length. The Democrats also held a 3-day convention in 1948.
* 1956 - Republicans adopted the current 4-day convention schedule.
* 1964 - Democrats adopted the 4-day schedule.
* Number of delegates:
The two parties had roughly the same number of delegates until 1956
| DEM | GOP | |
| 1956 | 1372 | 1323 |
Democrats begin steady upward growth in delegate numbers
| DEM | GOP | |
| 1960 | 1521 | 1331 |
| 1972 | 3016 | 1348 |
Republicans begin upward growth in delegate numbers
| DEM | GOP | |
| 1976 | 3008 | 2259 |
| 2004 | 4353 | 2509 |
Notably, the real growth in numbers of delegates at either Party convention has come up since the last time there was a multi-ballot nomination battle in either Party.
* 1948 - The last time the Republican Party held a multi-ballot nominating convention. Tom Dewey required 3 ballots. The previous multi-ballot Republican nominating battle was in 1940, when Wendall Wilkie needed 6 ballots to secure the nomination.
* 1952 - The last time the Democratic Party held a multi-ballot nomination convention. Adlai Stevenson required 3 ballots. The previous multi-ballot convention was Franklin D. Roosevelt's nomination in 1932 that required 4 ballots.
* Since 1960, there have been only three nominating conventions in either Party in which the nominee received less than 62% of the votes on the 1st ballot.
Democrats
- John Kennedy in 1960 - 53%
- Walter Mondale in 1984 - 56%
Republicans
- Gerry Ford in 1976 - 53%
Timing
* By historical practice, the Party controlling the White House has the 2nd convention.* The shortest period of time between the two conventions was 2 days in 1956. The second shortest period is the 3 days spread between the conventions in 2008.
* Over the years the timing of the conventions has played a game of "cat and mouse" with the Olympics. In 2000 the Olympics fell after the two conventions were complete. In 2004 it came between thprecedes both conventions.
The Olympics and the National Party Conventions 1980 - 2008
| 1980 | GOP 7/14-17 | Olympics 7/19-8/3 | DEM 8/11-14 |
| 1984 | DEM 7/16-19 | Olympics 7/29-8/12 | GOP 8/20-23 |
| 1988 | DEM 7/18-21 | GOP 8/15-18 | Olym 9/7-10/2 |
| 1992 | DEM 7/13-16 | Olympics 7/28-8/9 | GOP 8/17-20 |
| 1996 | Olympics 7/19-8/4 | GOP 8/12-15 | DEM 8/26-29 |
| 2000 | GOP 7/31-8/3 | DEM 8/14-17 | Olym 9/15-10/1 |
| 2004 | DEM 7/26-29 | Olympics 8/13-28 | GOP 8/30-9/2 |
| 2008 | Olympics 8/8-24 | DEM 8/25-28 | GOP 9/1-4 |
* The length of convention plenary sessions has remained relatively static - until this year.
- Republicans 16 - 23 hours
- Democrats 28 hours [The 2008 will be substantially shorter]
Electronic communication
* 1844 - News of convention proceedings was sent out by telegraph for the first time.* 1880 - The telephone was first used to transmit convention information.
* 1924 - The first convention was broadcast on radio, the Republican convention in Cleveland, Ohio.
* 1940 - The first transmission of reports by a television station came from the Republican convention in Philadelphia.
* 1948 - The first live convention reports were broadcast from the Republican convention.
* The quantity of TV coverage of conventions and the ratings received by that coverage has been dropping steadily.
* The total aggregate number of hours of coverage of each of the conventions by ABC, CBS and NBC (as a group) has dropped steadily over the last 4 conventions from an average of
- 19.5 hours in 1992
- 14.5 hours in 1996
- 11.0 hours in 2000
- 9.1 hours in 2004
Beginning with the 1960 conventions, the highest rated Democratic convention occurred in 1960 - 29.2. The highest rated Republican convention was 1976 - 31.5.
The aggregate ratings have dropped steadily since 1960, even though the number of networks broadcasting important parts of the conventions has grown from 3 in 1960 to 7 in 2004.
| Comparison of Combined Convention
ratings 1968-2004 (Based on Nielsen combined ratings with PBS added) |
||
| Democratic | Republican | |
| 2004 (ABC, CBS, NBC, CNN, MSNBC, FOXNC, PBS) | 15.2 |
16.7 |
| 2000 (ABC, CBS, NBC, CNN, MSNBC, FOXNC, PBS) | 16.8 | 15.3 |
| 1996 (ABC, CBS, NBC, CNN, PBS) | 17.2 | 16.5 |
| 1992 (ABC, CBS, NBC, CNN, PBS) | 22.0 | 20.5 |
| 1988 (ABC, CBS, NBC) | 19.8 | 18.3 |
| 1984 (ABC, CBS, NBC) | 23.4 | 19.2 |
| 1980 (ABC, CBS, NBC) | 27.0 | 21.6 |
| 1976 (ABC, CBS, NBC) | 25.2 | 31.5 |
| 1972 (ABC, CBS, NBC) | 18.3 | 23.4 |
| 1968 (ABC, CBS, NBC) | 28.5 | 26.4 |
| 1964 (ABC, CBS, NBC) | 28.8 | 21.8 |
| 1960 (ABC, CBS, NBC) | 29.2 | 28.0 |
The Convention Bounce
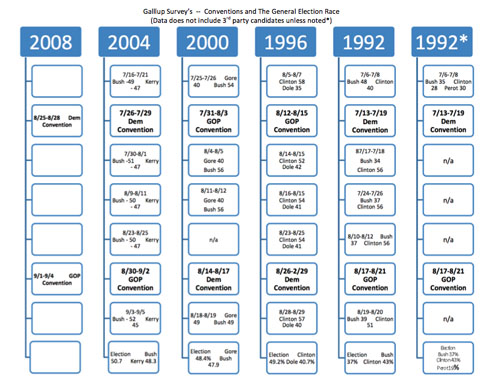
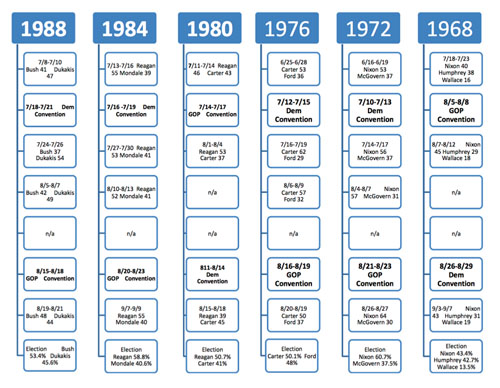
Is there really a so-called convention bounce? WW has looked at the pre/post convention Gallup surveys for each Presidential year going back to 1968. In six of the ten conventions since 1968 one or both conventions moved the numbers for the nominee of the Party in convention: 1968, 1976, 1980, 1992, 1996, and 2000.Movement after the 1992 Democratic convention was the most dramatic. In the two way race - Bush/Clinton - without Perot, Clinton jumped 16 points and Bush dropped 14 points.
A chart of the relevant data follows with blank spaces in which you can add the numbers for 2008.

Click for larger version (PDF)

Click for larger version (PDF)
